
Does the global temperature lag CO2? More flaws in the Shakun et al. paper in Nature.
Blog topic:
First some prologue. One of the annoying facts for alarmists is that ice cores with a sufficiently high resolution generally show that CO2 variations lag temperature variations by typically several hundred years. Thus, the ice cores cannot be used to quantify how large is the effect that CO2 has on the climate. In fact, there is no single time scale whatsoever over which CO2 variations can be shown to be the origin of temperature variations (not that such an effect shouldn’t be present, but because of its size, no fingerprint was actually found yet, even if you hear otherwise!). This fact stands as a nasty thorn in the alarmist story. So, it is no surprise that when Nature recently published that (finally) there is an observation showing that the temperature (and in particular, the average global temperature) lags CO2, that the alarmist community had a field day over it.
The abstract specifically writes (my emphasis):
These observations, together with transient global climate model simulations, support the conclusion that an antiphased hemispheric temperature response to ocean circulation changes superimposed on globally in-phase warming driven by increasing CO2 concentrations is an explanation for much of the temperature change at the end of the most recent ice age.
So, is there a catch?
It turns out that there are several problems with the Shakun et al. analysis. Some have already been pointed by other people (e.g., this, or that). I will concentrate on two new problems that particularly offended my intelligence.
First point: Lags, what do they mean?
I usually start “reading” an article by studying the figures, this way I am not distracted by the interpretation of the authors. And, one of the first things I noticed over this first glance was that indeed the global temperature appears to lag the CO2 variations, however, if you look at each hemisphere separately, it appears that the northern hemisphere lags the CO2 by 720±330 years, but the Southern hemisphere temperature leads the CO2 variations by 620±660 years. The same figure also reveals that the global temperature lags the CO2 by 460±340 years, which is the main find of the paper. Here are these graph (and the original caption).
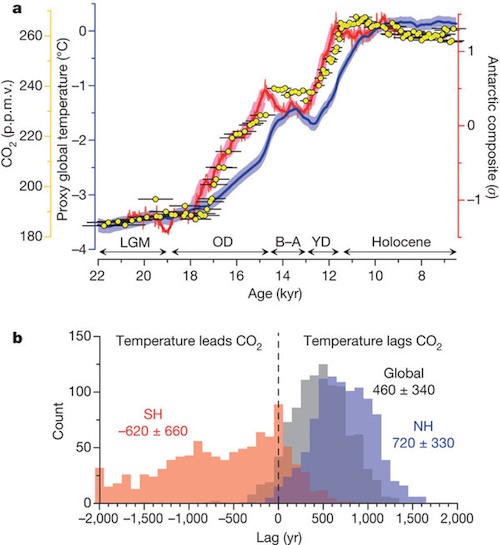
But what do the lags mean? First, it is clear from causality arguments that CO2 is probably affected by the temperature of the southern hemisphere. I write "probably" and not "definitely", because from a logical point of view, we cannot rule out that some other thing affects both the SH temperature and the CO2 with a larger lag. Nevertheless, this relation is actually quite reasonable given that the ocean temperature affects the equilibrium between carbon present in the oceans and CO2 in the air. Since there is way more water volume in the southern oceans than there is in the northern hemisphere, it is clear that the CO2 should be more sensitive to variations in the southern hemisphere than to variations in the northern hemisphere.
However, the fact that the northern hemisphere temperature lags the CO2 does not imply that the NH is actually affected by the CO2. Compare the following:
I. Southern Hemisphere T -> CO2 -> NH Temperature
with
II.Southern Hemisphere T -> CO2 with one lag, Southern Hemisphere T -> Northern Hemisphere T with a larger lag (say, through global ocean currents).
How can you differentiate between the two options? You can't! This means that the above result means nothing in particular, except as mentioned before, that CO2 is probably affected by temperature, in particular, that of the southern hemisphere. In defense of the authors, I must say that when they have written in the abstract "an explanation" and not "the explanation" (see quote above), they were accurately portraying the indecisiveness of their results...
Second point: Global temperature?
Given the fact that the global temperature is composed of the SH and NH and that one precedes and the other lags the CO2, is there any meaning to averaging the two? Perhaps not if the physical behavior is different (at least for the particular temporal window studied in their paper). Even so, one would imagine that such an average for the global temperature should be half of the NH and half of the SH. This is because, at least last that I checked, exactly half of the Earth's surface area is in the Northern hemisphere and half is in the southern hemisphere (unlike comparison of the land area, or the temperature proxy data in the Shakun et al. paper).
With this in mind, I started playing with the data. I was utterly surprised to learn that in order to recover their average "global" temperature, I needed to mix about 37% of their southern hemisphere temperature with 63% of their northern hemisphere temperature. In other words, their "global" temperature is highly distorted towards the Northern hemisphere! It is therefore no surprise that once they do find a northern hemisphere temperature lag, also their global temperature exhibits a similar lag, but it is not a global temperature by any means!
My suspicion is that the authors have a different averaging weight to the two hemispheres because of the asymmetry in their data distribution, however, their global temperature is close to but not exactly the ratio in the number of datasets in each hemisphere, so I don't actually know what they did.
Together with the faults pointed out by other people (most notably on WUWT), the Shakun et al. paper should not be considered as anything which proves that CO2 has a large effect on climate. My prophesy, though, is that the Shakun et al. paper will become a major hallmark in the next IPCC scientific report. This is because the alarmist community needs it badly as evidence that CO2 has a large effect of climate. They will also ignore all the major flaws which exist in it, because it will be convenient for them to do so. I hope I'm wrong, but I feel I'm right, and not only because one of the co-authors on the paper is also a lead author of the upcoming IPCC AR5 report.
How much of the warming since the last ice-age should be attributed to CO2?
Since this is a science blog after all, I thought it would be appropriate to end this post with more solid science in it.
Overall, there was a 3.5°C degree increase taking place concurrently to a CO2 increase from 180 to 280 ppm. If the warming is entirely due to CO2, then the climate sensitivity should be ΔTx2 ~ 3.5°C/log2(280/180), or about 5.5°C per CO2 doubling. But as I explained above, this conclusions is not supported at all by the above correlation. However, it does imply that if anyone is calculating a probability distribution function for the temperature sensitivity to CO2, then they should cut it at 5.5°C, because it simply cannot be any larger than that.
On the other hand, my best estimate for the climate sensitivity, is that CO2 doubling should cause a 1 to 1.5°C temperature increase, or about 0.65 to 1°C for a 180 to 280 increase in the CO2. In other words, at most a quarter of the observed 3.5°C should have been caused by the CO2 feedback. The rest is something else.
Comments (19)
Good points. One also can contrast to other proxy reconstructions. For instance, if data in
ftp://ftp.ncdc.noaa.gov/pub/data/paleo/icecore/greenland/summit/gisp2/isotopes/gisp2_temp_accum_alley2000.txt
and
ftp://ftp.ncdc.noaa.gov/pub/data/paleo/icecore/antarctica/epica_domec/edc-co2.txt
is graphed for the period from 200 to 11000 years ago, the result is the following rather striking contrast between Greenland temperature variations (GISP 2) and CO2:
http://www.climate4you.com/images/GISP2%20TemperatureSince10700%20BP%20with%20CO2%20from%20EPICA%20DomeC.gif
I am somewhat repeating a WUWT article here, though, perhaps one already seen. I was involved in debate in the comment section of
http://wattsupwiththat.com/2012/04/11/does-co2-correlate-with-temperature-history-a-look-at-multiple-timescales-in-the-context-of-the-shakun-et-al-paper/
there are many problems with this analysis. It just demonstrates the level of validation that a paper supporting the dogma has to undergo - not a very high one by any standard!
I've enjoyed learning particularly from the publications of Dr. Svensmark and you, only hoping that eventually more people join (or support in funding or otherwise) real advancement of climate science.
Incidentally, personally I think, when you write an article like this one, you might want to consider submitting a copy to Watts Up With That too. According to a traffic estimate (quantcast.com), WUWT gets millions of page views a month and 100000 page views a day from ~ 20000+ visitors a day, so it could be a vast bonus audience. (Although your site at sciencebits.com is excellent in content and doing well considering natural differences like WUWT traffic being driven partially from its sheer frequency of new articles a week, alexa.com does estimate on the order of 120x the total monthly traffic for wattsupwiththat.com, so getting articles seen on both sometimes could be of value). I've done so successfully through the form at http://wattsupwiththat.com/submit-story/ , and I'm basically an anonymous engineer with less climatology-related qualification than you by far, so the likelihood of a submission from you being accepted ought to be high.
I hope you keep up the good work over the next few years, as I am guessing they may be an interesting time, if the current weak solar cycle 24 peaks soon and if some solar predictions turn out to be partially accurate. If, perhaps, afterwards later this decade we see relatively prolonged major increase in cosmic ray flux unprecedented in the recent period of modern instrumental data, that would be an opportunity to show resulting effects in detail, maybe even so blatant as to indirectly substantially impact public debate and research.
a. Thanks. Indeed, people like Svensmark and myself try to do honest science as good as we can. The problem is that if you're not on the politically correct side of the political ship, you end up fighting an uphill battle, and have only meagre funding. That's life, but the rewards will be plentiful (I hope).
b. We do have more interesting results up our sleeves, but it takes time for them to get published...
d. I feel comfortable on my blog. Sometimes people ask me to report articles somewhere else, and if the sites are of high quality I don't object (e.g., Lubos Motl's or Joanne Nova's sites).
Cheers
-- Nir
It seems to me that there are many conclusions one could draw from the Shakun data, but the one they did was attention grabbing nonsense. However, perhaps you can help me reconcile something else.
The data do seem to suggest that the process of deglaciation begins in the Southern latitudes. Well, that's cool, but it doesn't jive with the Milankovitch hypothesis very well at all: THe best correlation with temperature is positively with the rate of change of Northern Hemisphere insolation. So how does an increase in Northern Hemisphere oscillation warm the Southern latitudes before it warms the latitudes it actually occured at? To make matters worse, isn't insolation decreasing where and when the deglaciation actually starts?
I am not an opponent of the Milankovitch hypothesis and I don't want to be confrontational so I apologize if I am coming of a little harsh. That is not my intent. I am very puzzled, however, and welcome any suggestions as to how these apparent inconsistencies might be explained.
I think you're right that the Shakun et al. has a few interesting but perplexing results, but those were totally overshadowed by their quest for immediate attention.
The truth is that from all the different time scales of climate variability this is the one I understand the least. People say that it is the northern hemisphere sensitivity to Milankovitch which drives the rest of the climate change, but no one really understand how it operates. If so, one could explain why the 100,000 year eccentricity variations are the dominant ones, even though the obliquity and precession should have generated a significantly larger climate signal. But this is still a big riddle. The bottom line is that I don't have an answer.
From what I read, the 100 ka eccentricity hypothesis has been disproved. The driver still is the 40 ka obliquity but it no longer initiates deglaciation every time but rather every second or third time only. The true durations are thus either about 80 or about 120 ka, averaging to but not equalling 100 ka.
See: Huybers & Wunsch, nature _434_(2005), 491--494; Huybers, nature _480_(2011), 229--231; Kawamura, nature _448_(2007), 912--916; Laepple, nature _471_(2011), 91--94; Lisiecki et al, nature _456_(2008), 85--88 (mainly the first two by Huybers).
So how does an increase in Northern Hemisphere oscillation warm the Southern latitudes before it warms the latitudes it actually occured at?
I think the gymnastic looks like this: Northern insolation --> ice melting (without warming) --> fresh water --> stopping ocean currents --> less warm water outflow from the south --> southern warming.
The melting without warming part is the interesting thing. Sometimes I think they say melting without "global" warming, but I guess they need melting without "local" (or hemispheric) warming.
I am afraid the analysis from Shakun is quite different than your suggestion, and I find a little strange your interpretation above - first of all since the the paper is very clear that deglaciation was not a simple process than can be (mis)characterized by just the lag to or from CO2.
The best simple description of the process IMHO is:
- the original trigger is orbital - graph (f) here;
- that it takes 2000-4000 years (from 22kyr to about 18kyr) for that orbital forcing to regionally accumulate (predominantly in the Northern Hemisphere) and be amplified by albedo feedbacks to a level which constantly but very slowly raises CO2
- that the CO2 raise is the main mechanism (but not the only one, the seesaw also seems an essential part) that also warms the Southern Hemisphere - which would otherwise see some cooling (see the extra bright-red line that follows the negative orbital forcing for SH here) - and that a "seesaw" process is initiated
- that in the absence of the warming from CO2 the orbital effect + albedo feedbacks would most likely never be able to achieve large-scale deglaciation - in the first image graph (e) models the temperature response from just the orbital forcing, and I have also extended graph (d) with a bright-green line which is following orbital forcing + albedo feedback - and as a result that actually reconstructed trend is steeper than graph (d) since it also contains some minor feedback - but is a clearly below the actual massive temperature increase caused by CO2.
As I wrote further up, I really don't understand what's going on over this time scale. Lubos Motl pointed out to me that a much better fit between Milankovich and the climate is by assuming that the d(ice-volume)/dt is proportional to the NH insolation (with caveats, such as the proportionality depends on the sign - easier to melt than to freeze, etc). This implies that we shouldn't just compare the temperature with the NH insolation. Other than this dime's worth of info, I have nothing smart to say about it.
Thanks, Nir. I followed Lubo's explanation on his blog when he brought it up.
In defense of Milankovitch by Gerard
Yes, thank you, nuclear_is_good. I wasn't dealing with the details. I think the problem is the difference between local, hemispheric, and global temperatures. They talk about a triggering (small) local northern warming (60ºN -90ºN in the graph you point to). Then, the seesaw, via AMOC.
In their words:
We attribute the (hemispheric) variability in DT to variation sin the strength of the AMOC and its attendant effects on crossequatorialheat transport
The CO2 rise comes from the southern warming, which comes from the AMOC change, which comes from the small and local (60ºN -90ºN) warming and ice melting.
The reason for the seesaw is the AMOC stopping. Their words:
The second increase occurs during a pronounced interhemispheric seesaw event (Fig. 5), presumably related to a reduction in AMOC strength,
So, I understand in their scenario, northern insolation, AMOC, seesaw, southern hemisphere an equatorial temp rise, CO2 rise, and global temperature rise, are all the same mechanism, with different timings.
I may be wrong, but I don't think it could be for the reasons you bring.
You really think that your second option is a viable alternative? That the action of a long-lived gas in the atmosphere is restricted to the southern hemisphere? I think this is nonsense.
Obvious nonsense. Goes down well at WUWT, but not so much at Nature.
3 to 5 years is not a long residence time.
Raven, CO2 is not "long lived" in these time frames (the ipcc imagines 50 to 200 years, far less than the lags discussed here). “
Shakun citation:
"But if you reconstruct temperatures on a global scale – and not just examine Antarctic temperatures – it becomes apparent that the CO2 change slightly preceded much of the global warming, and this means the global greenhouse effect had an important role in driving up global temperatures and bringing the planet out of the last Ice Age,” Shakun added."
If you can't find big potholes in that argument, you might want to try again.
Best regards,
Dear Shaviv, thanks for the reasoning. I however, have problems with the concept of a uniform climate sensitivity, certainly for a non-uniform forcing (if there is such a thing as a uniform forcing - can't think of any). I you take any of the feedback mechanisms (positive and negative), each will exhibit thresholds and non-linearities. Summing them up, with a non-uniform forcing, will certainly not yield a constant climate sensitivity. How do you justify the concept? I've asked the same question to warmists but I get no answer, and I haven't found any justification in the IPCC reports. A bit frustrating to be honest :-)
that the forcings may be nonlinear, depend on location, temperature or other characteristics of the physical states. But, I think the major forcings, those of water vapor, and cloud cover are close to linear in the relevant range of a few degrees, and they certainly don't have a threshold. The other feedbacks are smaller and will tend to average out their nonlinearities and thresholds if they have any. The situation might be different if there are two stable solutions for the equilibrium at a given temperature (e.g., earth with a lot of ice and earth with a litte). In such a case you might get a nonlinear global response. I wouldn't be surprised if this plays a role in the two-state behavior of Earth between ice-ages and interglacials, but I am not sure it is even required.
Anyway, if you look at this page on climate sensitivity, and in particular, at panel B of figure 2, you will see that empirically, there seems to be no significant temperature dependence of the climate sensitivity.
Off topic, but maybe interesting to you.
http://wattsupwiththat.com/2012/06/19/the-intriguing-problem-of-the-younger-dryaswhat-does-it-mean-and-what-caused-it/
The multiple nature of YD moraines in widely separated areas of the world and in both hemispheres indicates that the YD consisted of more than a single climatic event and these occurred virtually simultaneously worldwide. Both ice sheets and alpine glaciers were sensitive to the multiple YD phases. The GISP2 ice core shows two peaks within the YD that match the glacial record. The absence of a time lag between the N and S Hemispheres glacial fluctuations precludes an ocean cause and is not consistent with the North Atlantic Deep Ocean Water hypothesis for the cause of the Younger Dryas, nor with a cosmic impact or volcanic origin.
Both 14C and 10Be production rates in the upper atmosphere changed during the YD. 14C and 10Be are isotopes produced by collision of incoming radiation with atoms in the upper atmosphere. The change in their production rates means that the Younger Dryas was associated with changes in the amount of radiation entering the Earth’s atmosphere, leading to the intriguing possibility that the YD was caused by solar fluctuations.