
The worst of the BEST
I was asked by quite a few people about my opinion on the BEST analysis of Richard Muller and his group in Berkeley. Since I didn’t want to keep my friends without an answer, I took a more careful look into the analysis. Here is what I think of it.
[Edit 2019: I noticed that the Berkeley website changed its structure, so the link is dead. However, the actual paper has since appeared]
There are two parts to the analysis. The first part is a reconstruction of the temperature over the 20th century. The second part includes analyzing this reconstruction and drawing various conclusions out of it.
I will divide my discussion into the two parts. Since I am no expert in temperature reconstruction, and in particular on the possible biases that may appear, the first part will be rather short.
The BEST temperature reconstruction
At face value, the methodology that Muller’s group takes seems novel and capable of reconstructing the data more systematically. Thus, I have no reason to doubt that this reconstruction could not in principle be superior to previous reconstructions.
However, as pointed out by Ross McKitrick (on his site, and the actual report), it has a major drawback. Presently, there is no publicly available information about the data used or all the details describing the analysis pipeline. Without being able to independently carry out the BEST reconstruction, it is impossible to check it, and it should therefore be considered very cautiously.
Analysis of the BEST temperature reconstruction
The second part, that of analyzing the reconstruction, is more problematic. To understand where the problems are, let us summarize the conclusions that Muller et al. reach from analyzing their data.
- The BEST data indicates that there is little or no urban heat island effect.
- There is no correlation with solar activity, indicating that it is not important for climate change.
- They claim that the climate sensitivity to CO2 changes are 3.1 ± 0.3°C per CO2 doubling.
- They claim that volcanos and CO2 do a good job explaining the temperature increase over the 20th century.
Let me address each one of these points.
There is no urban heat island effect
In the Muller et al. analysis, "Very Rural" sites were defined as those locations which are 0.1° distant from an urban, i.e., from pixels defined as "urban" using the MODIS satellite. They then find that the average temperature minus the rural average temperature exhibits no trend (-0.10 ± 0.24°C/century over the past 50 years, or a net contribution of −0.05 ±0.12 °C at 95% confidence over this period).
For comparison, the analyses of McKitrick & Micheals (2004, 2007) and McKitrick & Nierenberg (2010) do show that there is a large effect. Here, the authors correlate the spatial distribution of warming with the spatial distribution of socio-economic index growth, and they find a significant correlation. To check their results, they correlate the rise in the socio-economic index with a GCM modeled temperature rise, and see no correlation. They conclude that the real temperature data therefore has contamination from urbanization.
The truth is that when I originally read the different papers, I couldn’t say anything definitive myself (at least, not without spending more time I didn’t have). However, I did meet Ross McKitrick at the end of the summer, so I could actually ask him in person. The answer I got is very interesting (and you can find it in the referee report he wrote about BEST).
According to McKitrick, one has to be very careful when considering the urban heat island effect because it is easy to get counter intuitive effects.
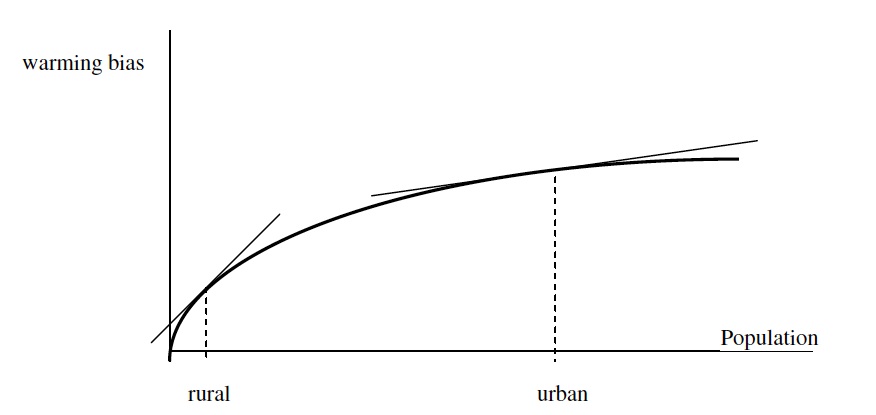
Suppose we consider an effect (like the figure below) which grows logarithmically with time (because it is sensitive to the initial increase with population but less sensitive once the population is large). In such a case, the derivative of the temperature with respect of the population will be large when the population is small and small when the population is large. The bias will then be more pronounced when the population is small, not when it is large. However, because the BEST group didn’t characterized their very-rural sites, it is very hard to check whether such a bias exists or not. In other words, the fact that they don’t see an urban heat island effect doesn’t mean that it is not there.
No correlation with solar activity.
The claim that there is no correlation between solar activity and the BEST temperature reconstruction, seemed strange to me when I first read it. The reason is that it is evident from a large body of work (including that which I have done) that the sun has a clear effect on climate and it is large. Perhaps the best single piece of evidence that not only unequivocally proves that the sun has an effect on the climate, but actually quantifies is in terms of radiative forcing, is the heat which goes into the oceans every solar cycle. This can be readily seen in the total oceanic heat content, in the sea surface temperature and most beautifully in the tide gauge records, as I elaborate in this post .
Given that Muller is a smart guy, and having met him, I know that he is an honest scientist (and an original one too), all I can say is that he is not aware of this data which unequivocally proves that the sun has a large effect on the climate.
But this however doesn’t explain why the Berkeley group didn't see any correlation. So why didn't they?
Muller et al. checked two correlations between their reconstructed temperature and the solar activity (which I presume is the latest irradiance reconstruction used by the IPCC, they don’t actually give a reference, at least I couldn't find it). One correlation is between the annual values of both records and the second correlation is between the decadally averaged values. Both lack of correlations are easy to understand, but they deserve separate considerations.
The lack of correlation between the annual values is due to the fact that they are looking for an instantaneous linear relation, that is, they carry out a linear regression in the form $$T(t) =a F_\odot (t) + b \ln (pCO_2) + ... $$ However, the key point here is that Earth’s climate is a low pass filter. This means two things. First, the relation between the forcing and temperature changes and is not instantaneous (there is a lag and smearing because of the heat diffusion, primarily in the oceans). Second, the ratio between the forcing and the response on short time scales and the ratio between the forcing and the response on long time scales is different (because of the low pass filter behavior of the climate system, it damps response over short time scales). The ratio is a factor of around 3 to 4 between the 11 year response and the centennial response. As a consequence, the fit suppresses any solar contribution over long times scales because the short term variations due to the solar cycle will ruin the fit. So, any linear regression to the annual data is bound to fail.
The second correlation is between the decadally average data sets. Here, the problem is different. Because this averaging wipes out all the details on short time scales, the time series left has relatively little information. Because solar activity mostly increased over the 20th century, just like other things, a fit to the decadally averaged data cannot effectively constrain the solar contribution. According to the BEST team, this contribution is 0.6 ± 1.7 °C per W/m2. Although it depends on the exact solar reconstruction, one typically finds that the average solar activity increase over the 20th century is comparable to the variations between solar minimum to solar maximum over the 11 yr cycle. Since those are 0.17 W/m2 (in the irradiance), one finds that Muller et al. constrain the solar contribution over the 20th century to be 0.1 ± 0.3°C (at one σ). My best estimate for the solar contribution is 0.3 to 0.4 °C (see Ziskin & Shaviv), i.e, consistent with their "null" result, which actually includes the real result within their large error.
In other words, the BEST analysis either fails because their regression model assumes an instantaneous response and the same response on different time scales, or, it provides a result which is meaningless given the large error it provides. In any case, they have NOT proven that the sun does NOT have a large effect on climate.
CO2 + volcanoes do a good job fitting the 20th century.
The next claim of the BEST team is that just CO2 and volcanic forcing does a good job fitting their reconstructed temperature time series. Well, they don't do a good job for two reasons.
First, when we consider the possibility that the sun has an effect on the climate, but do so in a model which considered the diffusive (low pass) behavior of the climate system on short time scales, then we obtain a fit which is significantly better. The variance between the modeled and observed land data that we find (with more constraints, because we fit also the ocean data as well!) is a factor of 1.8 times smaller than Muller et al. In other words, the BEST team may be doing a good job, but they are far from really being best. We are better. In fact, we also do twice better than GCM fits to 20th century. Our secret is of course that we allow the sun to have a large effect on the climate. This large effect on the climate should be an undisputed fact given the large changes in the ocean heat content over the solar cycle. But alarmists developed a blind spot to evidence contradicting their claims.
Second, the BEST fit is unphysical. In it, they used two independent prefactors relating the CO2 forcing and the volcanic forcing to the temperature response. However, there is a physical relation. (Since the radiative forcing of volcanoes and of CO2 is supposed to be known, choosing different prefactors is equivalent to having a different climate sensitivity for the two different processes). Lindzen and Giannitsis have shown that if you impose a high climate sensitivity (which you need if you want to explain the 20th century with just CO2), then the volcanic response on short time scales is too large (that is, Muller et al. assume that the volcanoes are doing less than they should). We also find that volcanoes would produce too large an effect if the climate sensitivity is too large. This is another reason why our model prefers a low climate sensitivity. (The first being that it likes a solar contribution to fit the short term variations).
Climate sensitivity is large
Given the above, it is clear why the Berkeley group obtain a high climate sensitivity. If all they have is just CO2, then yeah, you need a high sensitivity which is about 3°C per CO2 doubling in order to explain 20th century warming. However, they are missing other forcings. For example, the indirect aerosol effect can increase their sensitivity (because it cools, but nobody knows by how much), while if you take the sun into account, the models prefer smaller sensitivities. Moreover, if one takes a real model which includes the diffusive components (and thus produce the lags/low pass filter behavior) one finds an even better fit with a preferentially low sensitivity. Now I must say that they did point out in their paper that they only used CO2 to proxy all the anthropogenic activity and therefore the sensitivity should be modified, however, I am quite sure that people will start quoting their number as the real climate sensitivity with the ridiculously small error that they obtained. You have been warned.
To summarize, I think the BEST methodology towards reconstructing the temperature has its merits. However, the conclusions from their follow up analyses are unfounded. This is primarily because they used modeling which is too simple (and with it they killed the solar effect) and unphysical (response to volcanic forcing is much smaller than the response to CO2 forcing).
Don’t get me wrong. I do think it is good that independent analyses are done to reconstruct the temperature. The response in the climate community was luke warm at best, partially because an “outsider” group came an entered their own territory. This just proves that independent analyses are important.