
Influenza and a Human Chain Reaction
Blog topic:
It turns out that I was twice wrong in that estimate, once because I overestimated the effects that the fright will have on the flu vaccination rate, and once because I highly underestimated the effect this reduced vaccination rate will have on the spreading of the disease. The latter is of course because I neglected the human chain reaction element. Yes, the behavior of a flu pandemic is not unlike that of the chain reaction in nuclear fission bombs. Let me explain.
According to the news, the number of people in Israel who received the flu vaccinations until the beginning of January is roughly 800,000, out of a population of 7,000,000. This year however, the number was about 600,000. It was because of the flu fright of course. In other words, normally, 11.5% of the population is inoculated by this time of the year, while this year, only 8.5%. Not a big difference. At least so I thought.
This small change in the vaccination rate made me wonder. First, given that the fright was in headline news for quite a while, I was sure the effect will be larger, but it wasn't. Hurray! The population is wiser than I gave it credit. Nevertheless, I was still left wondering. If there was such a small change (instead of having 88.5% of the population susceptible to catching the flu, this year, the number was 92.5%, i.e., a factor of 1.045 higher), how come that this year, the infection rate of the flu is TWICE as high as last year!? Given that the fraction of the population susceptible to flu infection is only marginally different, I thought at first that the reduction in the flu vaccination rate couldn't have been the source of this huge infection rate increase. A factor of two mind you! Well, I was certainly wrong with that assertion.
Pandemic Infections are not unlike the chain reaction in nuclear fission. In Uranium 235, for example, one spontaneous decay of a nucleus will release a few neutrons (about 2.5 on average). If the chunk of Uranium is large enough, then these neutrons will be absorbed by other Uranium 235 nuclei. Each of those would then emit 2.5 neutrons on average, which will be absorbed by other nuclei, and so on. This means that the number of neutrons after n generations would be 2.5n. i.e., the number of fission reactions would be HUGE after very few generations. It grows exponentially with time.
If the chunk of Uranium is small, not all neutrons will be absorbed by other U-235 nuclei, thus, instead causing 2.5 nuclei to break apart, each U-235 will cause less. If the chunk is small enough, each U-235 undergoing fission will cause less than one U-235 to break, and no chain reaction will take place. For Uranium, this critical size is about 20 kg, but it depends on the geometry.
So why is a flu pandemic similar? Clearly, every flu patient has some probability of infecting other people. If the average number of people he or she will infect is larger than unity, the number of infections will grow exponentially as well.
To see how such a small change in the infection rate can explain the factor of 2 change in the overall number of infections, we can construct a simple toy model.
Suppose that time is discretisized. Given that the flu can infect the next victim already 24 to 48 hours after first contact, and that the flu typically lasts a week, the average time step will be roughly a day plus half the infectious period, i.e., something like 4 days between one infection and the subsequent one, at least on average.
Suppose that at any given time step i, there are $n_{i}$ sick people, out of the total population of $P$. The pool of people that can actually be infected is smaller, it is $(1-f_{vac}) P - N_{i-1} $, where $(1-f_{vac})$ is the fraction of people who were not vaccinated, and $N_{i-1} \equiv \sum_{k=0}^{i-1} n_k $ is the total number of people who had the flu by the previous type step.
The total number of people $n_{i}$ who will be infected at time step i is going to be proportional to the total number of sick people at time step i-1 and the total population which can potentially be infected (if more are vaccinated, or more were already sick, then less new people will get sick). This proportionality constant, $f_{tr}$ will depend of course on different conditions. In winter, when the flu is more contagious, it will be higher for example. Thus, the equation describing the evolution of the number of flu infections is: $$ n_i = n_{i-1} \left[ (1-f_{vac} ) P - N_{i-i} \right] f_{tr} .$$ This equation can tell us much about the behavior of the flu pandemics.
First, it is clear why the flu is like a chain reaction. As long is the total number of infected people is small compared to the total population, the number of infected people simply grows exponentially: $$ n_i \approx n_{i-1} \left[ (1-f_{vac} ) P - N_{i-i} \right] f_{tr} ~~\Rightarrow ~~ n_i \approx n_0 \left[ (1-f_{vac} ) P - N_{i-i} \right]^i .$$ To get a chain reaction, we need the bracketed term to be larger than unity. In principle, if we know how fast an outbreak grows, we can estimate the fraction of the population which should be vaccinated in order to stop the spreading. For example, if the number of patients doubles in a month, then it means that the doubling takes place after about 30/4 ~ 8 infection "time steps". This implies that each patient infects on average: $$ {n_i \over n_{i-1}} \approx \left[ (1-f_{vac} ) P - N_{i-i} \right] f_{tr} \sim 2^{1/8} \approx 1.1 $$ other people. Thus, if we inoculate about 10% more of the population, the outbreak will start diminishing.
Second, if we inoculate less, then the growth of the number infected will be larger. In fact, as long as the fraction infected is still small, we have that the ratio between the number infected in one case ("1") and in another ("2") after $i$ time steps is going to be: $$ {n_{i,1} \over n_{i,2}} \approx \left( 1-f_{vac,1} \over 1-f_{vac,2} \right)^i . $$ Clearly, if we have a 3% change in the rate of inoculations, then after 3 months, which is (3*30/4)~22 infection time steps, we can have a factor of 1.0322~1.9 difference between the infection rates of the two cases!
Thus, the chain reaction nature of the flu pandemic can easily explain why the small difference in the vaccination rate could have caused the factor of 2 difference in the total number of flu cases. In fact, as time progresses, we can except this ratio to increase. It will do so as long as the case with the lower vaccination rate is still exponentially increasing.
Once the latter stops increasing when enough of the population was infected with the flu such that the $N_{i-1}$ term in the brackets becomes large enough. The ratio will then start decreasing. It will do so until the higher vaccination scenario will stop increasing as well, leaving a final ratio between the two scenarios.
To see this better, we can look at simple simulations, which are described in the figures below. Here, we take a base growth rate of 1.2 per generation (i.e., for a "fresh" population that received no vaccinations and had no flu cases yet). In one scenario, we have 10% of the population vaccinated, while it is 13% in another (this is similar to the case in Israel this year, as compared to the previous one). In both cases we begin with 10-5 of the population having the flu. The results are depicted below.
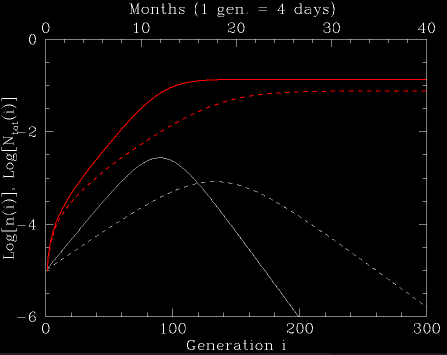
Fig. 1: The number of sick people, n(i), and the integrated number of sick people, Ntot(i), normalized to the population size, under two pandemic scenarios. In both, the base infection rate is 1.2 per generation for an non-vaccinated pre-outbreak population (i.e., assuming that an outbreak in a fresh population which had no vaccinations, would grow at a rate of 1.2 per generation). In the first case (solid lines), 10% of the population is vaccinated. In the second (dashed lines), 13% is vaccinated. The white lines are the number of sick people at a given infection generation. The red lines are the integrated number of sick people.
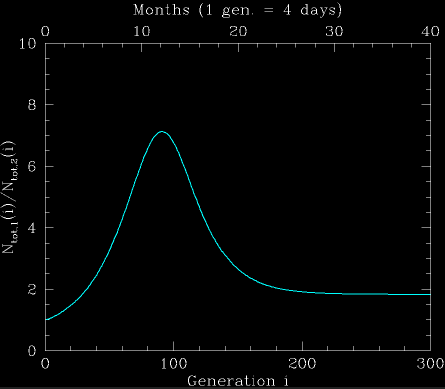
Fig. 2: The ratio between the integrated number of infections under both pandemic scenarios. Initially, the ratio rapidly increases since the number of sick people increases exponentially in both scenarios, but at different rates. After the lower vaccination rate scenario ends its "chain-reaction", when enough of the population was infected, the ratio starts decreasing. This continues until the higher vaccination rate scenario ends its chain reaction. The end ratio in this case is 2. It can be estimated analytically, as described in the text.
One interesting question remains open, though, at least for me. It is clear that for outbreaks to occur, the growth rate per generation should be larger than 1. However, why should it be nearly one and not much larger? In our example, the nominal value we had was 1.2. In other cases, it can even be much closer. For example, the avian flu outbreak grows very slowly. In fact, $q=P f_{tr}$ should be very nearly 1 to explain why the number of sick people grows by only a factor of two from year to year (say, 100 generations, giving $q \sim 2^{1/100}\approx 1.0007$ ). Clearly, there must be some nonlinear interaction which makes the infection rate more effective if it is small (and q<1), but less effective when larger (q>1), forcing q to be very nearly unity. So what is it? Perhaps I'll ponder about that, some other time...