Is the causal link between cosmic rays and cloud cover really dead??
Just recently, Sloan and Wolfendale published a paper in Environmental Research Letters, called "Testing the proposed causal link between cosmic rays and cloud cover". In the Institute of Physics Press Release, it said, "New research has deal a blow to the skeptics who argue that climate change is all due to cosmic rays rather than man made greenhouse gases". Did it really?
First, we should note that so called "skeptics" like myself or my serious colleagues never claimed that cosmic rays explain all the climate change, it does however explain most of the solar-climate link and a large fraction (perhaps 2/3's of the temperature increase over the 20th century).
Now for the paper itself.
Sloan and Wolfendale raise three points in their analysis. Although I certainly respect the authors (Arnold Wolfendale is very well known for his contributions to the subjects of cosmic rays and high energy astrophysics, he was even the astronomer royal, and for good reasons), their present critique rests on several faulty assumptions. Here I explain why each of the three arguments raised cannot be used to discredit the cosmic-ray/climate link.
Lack of latitudinal dependence:
According to Sloan and Wolfendale, if clouds are affected by the cosmic ray flux, they should exhibit the same latitudinal dependence as the cosmic ray flux variations. That is to say, because different magnetic latitudes have notably different cosmic ray flux variations, the relative cloud cover variations should similarly have a large dependence on the magnetic latitude. Although at first is sounds logical, this critique misses an important issue, and that is that the CRF variations at the top of the atmosphere are much larger than those at lower altitudes since the latter depends on the variations of much higher energy cosmic rays, those needed to penetrate the atmosphere. Let us look in more detail.
Sloan and Wolfendale compare the latitudinal dependence of solar min to solar max neutron monitor variations to the latitudinal variations of the solar-min to solar-max Low altitude Cloud Cover (LCC) variations. This wrongfully assumes that the ionization rate governing the low atmosphere (and with it the clouds) varies the same way as the neutron monitors.
The neutron monitors have a very weak dependence on the amount of atmosphere above them. The reason is that once neutrons are formed from cosmic ray spallation at the top of the atmosphere, they easily continue to the ground because they are neutral. This implies that the neutron monitor count rate will indeed be nearly proportional to the cosmic ray flux reaching the top of the atmosphere, and the latitudinal dependence will heavily depend on the magnetic cut-off.
On the other hand, the flux of ionizing particles to the lower atmosphere critically depends on the amount of atmosphere above. In fact only primary cosmic ray particles above about 10 GeV can generate showers of which their secondary charged particles can give any atmospheric ionization at an altitude of a few kilometers. The bulk of the low atmosphere ionization is actually generated by primary cosmic rays with energies a few times higher. This implies that the latitudinal dependence of the low altitude ionization rate is very weakly dependent on the magnetic latitude. This is because the magnetic field has an effect only for cosmic ray particles of 0 to 15 GeV, which are anyway blocked by the atmosphere!
Thus, the data to compare with would not have been with neutron monitor data but with ionization chambers which exhibit a much smaller latitudinal dependence. Another option is to calculate the actual latitudinal dependence of the atmospheric ionization variations. This was done by Usoskin et al. (2004), who took the top-of-the-atmosphere variations in the CRF, and using a code to calculate the shower products, calculated the actual latitudinal ionization rate variations.
They found that the relative change in the LCC is the same as the relative change in the ion density (which itself is proportional to the square root of the ionization rate). Both vary by several percent from equator to pole over the solar cycle. This can be seen in fig. 2. In other words, the latitudinal dependence of the cloud cover variations is totally consistent with the CRF/cloud cover mechanism. For comparison, the solar cycle variation in the neutron monitor data is almost 20% at the poles, and 5% at the equator.
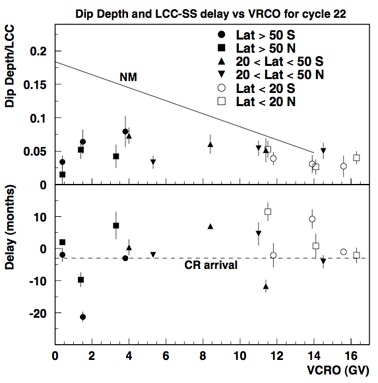
Fig 1: (from Sloan and Wolfendale). Top panel: Sloan and Wolfendale expect the solar-min to solar-max variations in the cloud cover to have the same latitudinal dependence (i.e., magnetic cut-off dependence) as that of the neutron monitor variations. This assumption ignores the fact that low atmosphere ionization is generated by CRF particles of relatively high energy, those needed to penetrate the atmosphere. As a consequence, the ionization variations are only of a few percent, and in fact consistent with the observed cloud cover variations (see fig. 2 below). Bottom panel: Sloan and Wolfendale find that the cloud cover variations lead the cosmic ray flux variations by about 3 months, which according to them, is inconsistent with the mechanism. As we show below, this lead is actually consistent given the climate response.
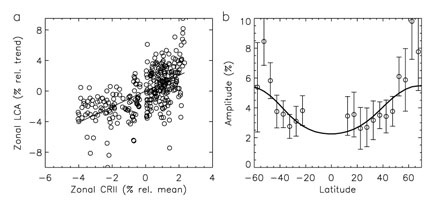
Fig 2: (From Usoskin et al. 2004). The observed latitudinal variation in the cloud cover as a function of the magnetic latitude (right) or as a function of the atmospheric ionization variations (left). The graphs clearly demonstrate that the cloud cover varies as expected from the ionization variations.
Cloud cover CRF lead:
The next criticism Sloan and Wolfendale raise is the fact that when the cloud cover is correlated with the cosmic ray flux over the 11-year solar cycle, it appears that the cloud cover leads the cosmic ray flux variations by about 3 months (see panel 2 of fig. 1 above). If cosmic ray flux affect the cloud cover, such a lead should not be observed.
This would have been the case if all the cloud cover variations arise only from cosmic ray flux variations. However, Sloan and Wolfendale did not consider that the clouds are part of the climate system. The cloud also react, for example, to the varying global temperature, either variations due to the solar cycle, which lag behind the radiative forcing, or altogether unrelated temperature variations.
We can estimate the phase mismatch between the cloud cover variations (arising from the 11-year solar cycle) and the cosmic ray flux. Towards this goal we need to estimate LCC changes arising from the temperature variations. This depends on the cloud feedback in the climate system. We can expect it to be between 1 to 2 (W/m2)/°C if we want the cloud feedback to give a climate sensitivity of 1 to 1.5°C per CO2 doubling, which is the sensitivity consistent with the cosmic ray cloud cover link (see http://www.sciencebits.com/OnClimateSensitivity).
We also know that the global temperature changes by about 0.1°C between solar maximum and solar minimum, with a delay of a 1/8 cycle. (e.g., Nir J. Shaviv, "On Climate Response to Changes in the Cosmic Ray Flux and Radiative Budget", JGR-Space, vol. 110, A08105, and references therein).
The two numbers imply that we should expect a cloud feedback radiative forcing of about [0.1°C] x [1 to 2 (W/m2)/°C] = 0.1 to 0.2 W/m2. Since ERBE shows that low altitude clouds are responsible for a net forcing of 17 W/m2 from their 30% area fraction coverage, if the cloud feedback is through low clouds, then we can expect an area fraction change of about (0.1-0.2) / 17 * 30% ~ 0.17 to 0.35%.
More quantitatively, we see that the LCC changes by about 1.5% over the solar cycle (presumably from the CRF variations). The total LCC will therefore precede the CRF by something like [(0.17-0.35%) / 1.5% / sqrt(2)] / (2π) of a cycle, i.e., about 1.8 to 3.5 months. This of course is consistent with the observations!
No apparent effect during Forbush decreases.
The last point raised by Sloan and Wolfendale is the fact that no effect is observed during Forbush decreases. These are several-day long events during which the CRF reaching Earth can decrease by as much as 10%-20%. Sloan and Wolfendale expect to see a decrease in the cloud cover during the events, but just like with the latitudinal effect, they expect to see an effect which is much larger than should actually be present.
Sloan and Wolfendale plot a graph for the cloud cover reduction vs. the cosmic ray reduction during Forbush events, based on the Oulu neutron monitor data. For the largest event, the Oulu neutron count rate decreased by about 15%. If the cloud reduction during the Forbush decreases should be similar to that over the solar cycle, a 7% reduction in the cloud cover is expected.
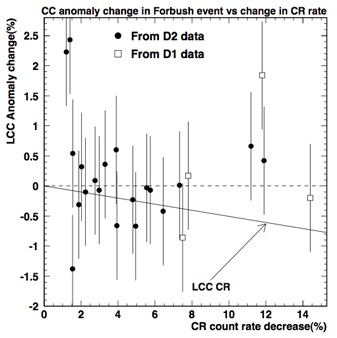
Fig 3: (From Sloan & Wolfendale) The reduction in the LCC during Forbush decreases. The straight line is the expectation according to Sloan and Wolfendale. The correct expectation should consider that the cloud data points are either weekly (D2) or monthly (D1) averages. Over these durations, the average CR reduction is smaller than the reduction over 1 day for example. For D2, the slope should be about 3 times smaller, and more than 10 times smaller for the D1 averages.
At face value this might seem like a real inconsistency, but at closer scrutiny it becomes clear where the discrepancy arises from. Fig. 3 plots the CRF reduction following the biggest Forbush event between 1982 and 2002, which took place in 1991. Indeed, one can see that the immediate reduction in the Oulu count is of order 15%, however, the data points for the cloud cover, plotted by Sloan and Wolfendale are either monthly average or weekly averages. Over the week following the 1991 even, the average CRF reduction in Oulu was actually roughly 5%, not 15%. This implies that the expected LCC anomaly is three times smaller, and therefore drowns under noise. The situation is much worse for the monthly data.
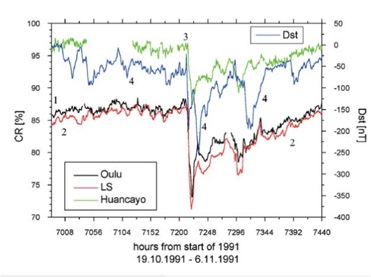
Fig: 4: The largest Forbush decrease between 1982 and 2002, from Kudela & Brenkus (2002). Over 1 day, the Oulu neutron monitor decrease is about 15%. However, if averaged over a week or a month, the average reduction is much smaller.
To see effects, one therefore needs to use daily averages of the cloud cover. This was done, for example, by Harrison and Stephenson (2006) who found that there is an apparent Forbush decrease in the cloud cover over Britain.
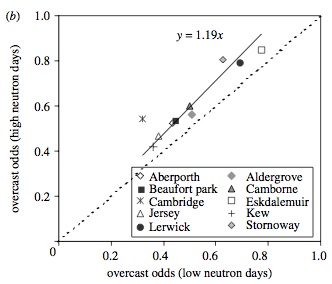
Fig 5: To see the effects of Forbush decreases, one has to look at daily data, and then, because of the noise, average many Forbush decreases. The graph depicted here demonstrates that during Forbush decreases, there is a statistically significant reduction in the odds for an overcast day. That is, less cosmic rays implies less clouds. The data is from Harrison and Stephenson (2006), for stations located in the UK.
Summary
Sloan and Wolfendale raised three critiques which supposedly discredit the CRF/climate link. A careful check, however, reveals that the arguments are inconsistent with the real expectations from the link. Two arguments are based on the expectation for effects which are much larger than should actually be present. In the third argument, they expect to see no phase lag, where one should actually be present. When carefully considering the link, Sloan and Wolfendale did not raise any argument which bares any implications to the validity or invalidity of the link.
One last point. Although many in the climate community try to do their best to disregard the evidence, there is a large solar-climate link, whether on the 11-year solar cycle (e.g., global temperature variations of 0.1°C), or on longer time scales. Currently, the cosmic-ray climate link is the only known mechanism which can explain the large size of the link, not to mention that independent CRF variations were shown to have climatic effects as well. As James Whitcomb Riley supposedly once said:
References:
- Harrison R.G. & D.B. Stephenson, Proc. Roy. Soc. A, doi:10.1098/rspa.2005.1628, 2006
- Kudela, K. & Brenkus, R., J. Atmos. Sol.-Terr. Phys. 66, 1121, 2004
- Shaviv, N.J., J. Geophys. Res. 110, A08105, 2005
- Sloan T. and A.W. Wolfendale, Environ. Res. Lett. 3 024001, 2008
- Usoskin, I.G., et al., Geophys. Res. Lett., 31, L16109, doi:10.1029/2004GL019507, 2004

Comments (31)
Hello Nir,
Enjoying your blog and patient style. Wondering if you had seen this yet? http://insciences.org/article.php?article_id=8012
"Study shows CFCs, cosmic rays major culprits for global warming" by Qing-Bin Lu
Pages