
The Sunspots 2.0? Irrelevant. The Sun, still is.
Blog topic:
First, what’s the story? A group led by Frédéric Clette had a presentation at the IAU assembly in Hawaii. In it, they argued that the sunspot number suffers from various systematic errors as it is a subjective measurement. Because those systematic errors vary with time (with the different observers and observational methods), the SN reconstruction can exhibit a fictitious long term trend. They also attempted to calibrate the data, and obtain a more homogeneous dataset. This is described at length in their arXiv preprint.
The most interesting aspect about their new sunspot reconstruction is that there is significantly less variation in the sunspot number between the different solar maxima since the Maunder minimum. This implies, according to them, that there wasn't a significant increase in solar activity over the 20th century (no "20th century Grand Maximum"), and therefore the sun should not have contributed anything towards increased temperatures. This point was of course captured by the media (e.g., here).
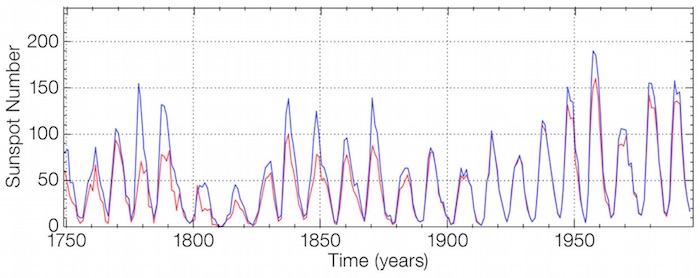
Figure 1: The old (red) and new (blue) sunspot number reconstructions of Clette et al.
So, what do I think about it? First, I have no idea whether the calibration is correct. They do make a good argument that the SN reconstruction is problematic. Namely, some corrections are probably necessary and there is no reason a priori to think that what they did is invalid. However, their claim about solar activity in general not varying much since the sun came out from the Mounder minimum is wrong. There are other more objective ways to reconstruct solar activity than subjective sunspot counting, and they do show us that solar activity increased over the 20th century. So at most, one can claim that solar activity has various facets, and that the maximum sunspot number is not a good indicator of all of them. This is not unreasonable since the number of sunspots would more directly reflect the amount of closed magnetic field lines, but not the open ones blowing in the solar wind.
The two important objective proxies for solar activity are cosmogenic isotopes (14C and 10Be), and the geomagnetic AA index. The AA index (measured since the middle of the 19th century) clearly shows that the latter part of the 20th century was more active than the latter half of the 19th century. The longer 10Be data set reveals that the latter half of the 20th century was more active than any preceding time since the Maunder minimum. (The 14C is a bit problematic because human nuclear bombs from the 1940's onwards generated a lot of atmospheric 14C so it cannot be used to reconstruct solar activity in the latter part of the 20th century).
Figure 2: The AA geomagnetic index showing a clear increase in solar activity over the 20th century (From here).
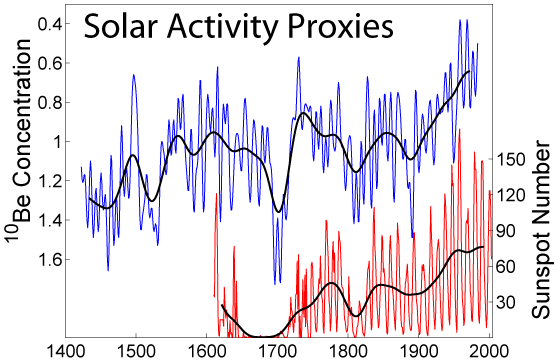
Figure 3: The 10Be production showing again, that the sun was particularly active in the latter half of the 20th century. The sunspot number is the "old" reconstructions without Clette's et al. corrections.
What does it tell us? Given that long term variations in Earth's climate do correlate with long term solar activity (e.g., see the first part of this) and given that some solar activity indicators (presumably?) don't show an increase from the Maunder minimum, but some do, it means that climate is sensitivite to those aspects of the solar activity that increased (e.g., solar wind), but not those more directly associated with the number of sunspots (e.g., UV or total solar irradiance). Thus, this result on the sunspots maxima (again, if true), only strengthens the idea that the solar climate link is through something related to the open magnetic field lines, such as the strength of the solar wind or the cosmic ray flux which it modulates.
The second point I wanted to write about is a recently published analysis showing that the sun has a large effect on climate, and quantifying it. In an earlier work, I showed that you can use the oceans as a calorimeter to see that the solar radiative forcing over the solar cycle is very large, by looking at various oceanic data sets (heat content, sea surface temperature and tide gauges). How large? About 6-7 times large than one can naively expect from changes in the solar irradiance.
More recently, Daniel Howard, Henrik Svesmark and I looked at the satellite altimetry data. It is similar to the tide gauge records in that it measures how much heat goes into the ocean by measuring the sea level change (most of the sea level on short time scales is due to thermal expansion). Unsurprisingly, we found that the satellite altimetry showed the same solar-cycle synchronized sea level change as the tide gauge records. However, because the satellite data is of such high quality, it is has a higher temporal resolution than the tide gauge records which allows singling out the thermal expansion component from other terms (e.g., associated with trapping of water on land). This allows for an even better estimate of the solar forcing, which is 1.33±0.34 W/m2 over the last solar cycle. You can see in fig. 4 how much the sun and el-Niño can explain a large fraction of the sea level change over yearly to decadal time scales.
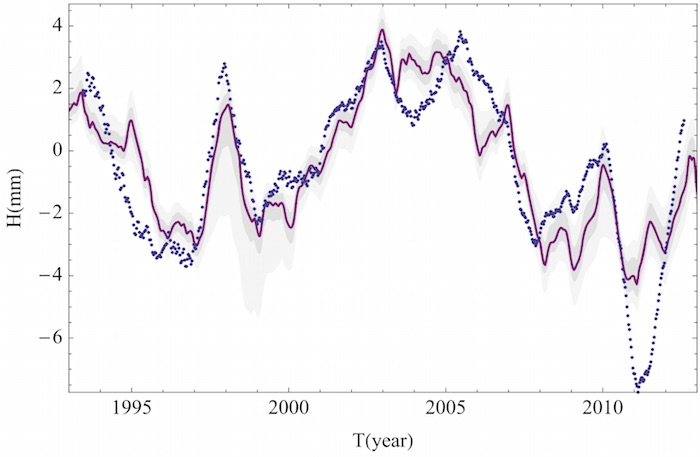
Figure 4: Sea level data and the model fit. The blue dots are the linearly detrended global sea level measured with satellite altimetry. The purple line is the model fit to the data which includes both a harmonic solar component and an ENSO contribution. The shaded regions denote
the one sigma and 1% to 99% confidence regions. The fit explains 71% of the observed variance in the filtered detrended data.
The bottom line is that the sun appears to have a large effect on the climate on various time scales. Whether or not the sunspots reflect the increase in solar activity since the Maunder minimum (as reflected in other datasets) is not very important. At most, if they don't reflect, it only strengthen's the idea that something associated with the solar wind does (such as the cosmic rays which they modulate).